The MPO identifies priority bridges, monitors pavement conditions, and now plans for stormwater impacts to transportation.
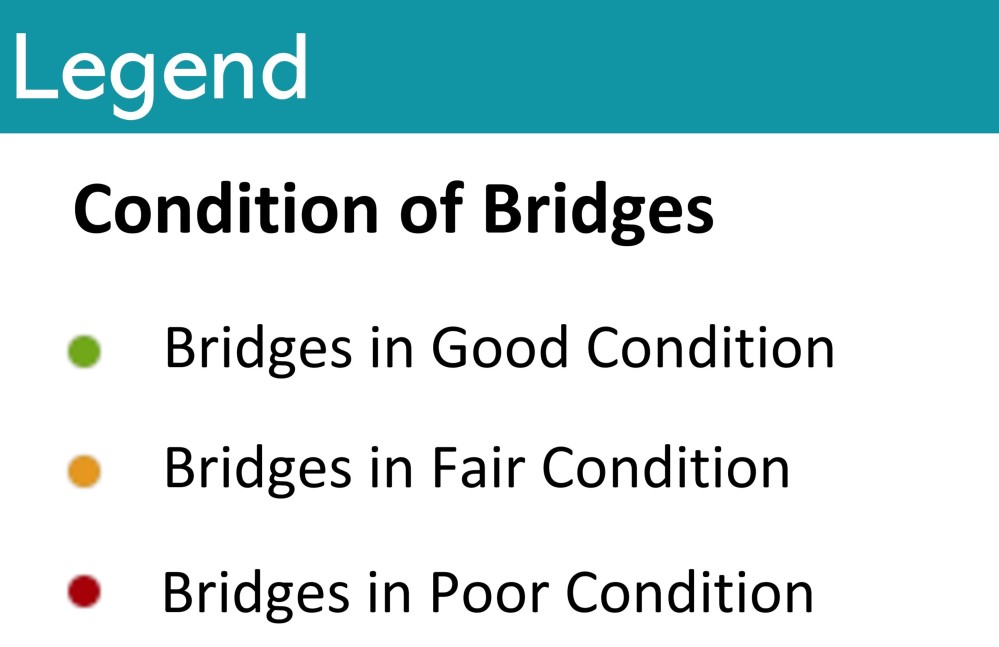
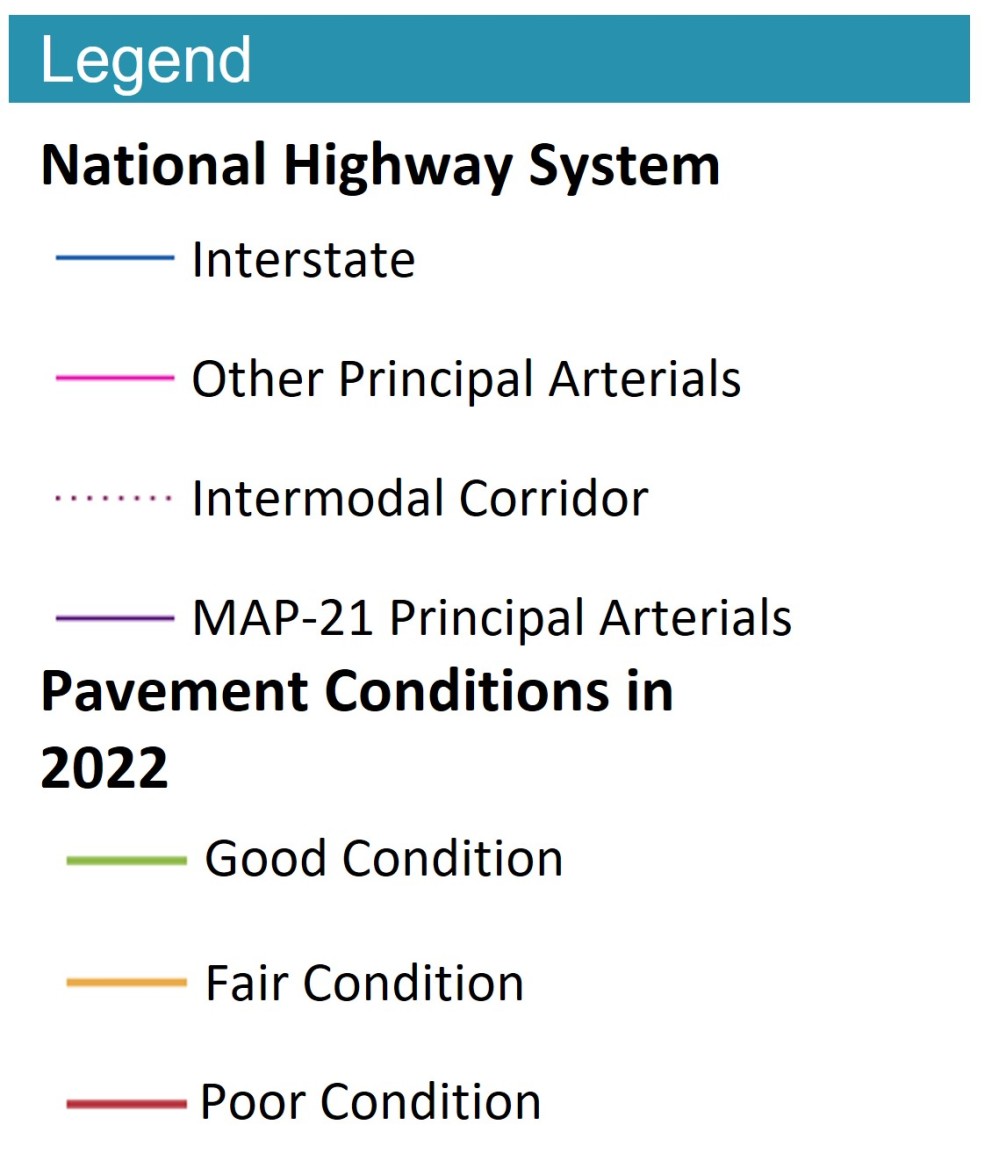
Bridges and pavements are graded on the quality of substructures, superstructures, deck surfaces, as well as the size, length, depth, and number of cracks, pot holes, and fissures. "Good Condition" suggests that no major investment is needed, and "Poor Condition" suggests major investment is needed.
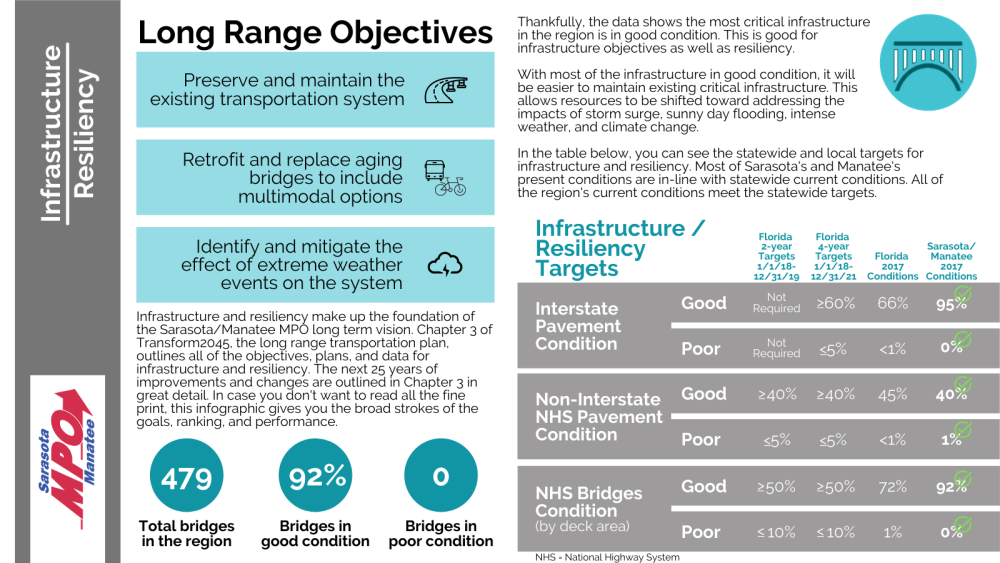
The four performance measures for pavement condition are as follows:
- % of Interstate pavements in Good condition
- % of Interstate pavements in Poor condition
- % of non-Interstate NHS pavements in Good condition
- % of non-Interstate NHS pavements in Poor condition
The two performance measures for bridge condition are as follows:
- % (by deck area) of NHS bridges in Good condition
- % (by deck area) of NHS bridges in Poor condition
On September 24, 2018, the Sarasota/Manatee MPO agreed to support FDOT's statewide pavement and bridge performance targets, thus agreeing to plan and program projects in the Transportation Improvement Program (TIP) that will, once implemented, make progress toward achieving the statewide targets.
Click infographic to enlarge

The map to the right shows bridge conditions in Sarasota/Manatee Counties. The National Bridge Inventory dataset is a part of the National Transportation Atlas Database. The most recent data is from June 2022. Most of the bridges in the region are in good condition, with only a handful in fair and poor condition.

The map to the right shows the pavement conditions in Sarasota/Manatee Counties. FDOT collects a performance inventory of the region's NHS (National Highway System) roads every four years, and 2017 is the most recent data. The data was updated in 2022, it includes paved principal arterial system roadways, NHS routes, all paved HPMS standard samples and all SIS-related roadways. Most of the NHS roads in the region are in good and fair condition, with only a handful in poor condition.

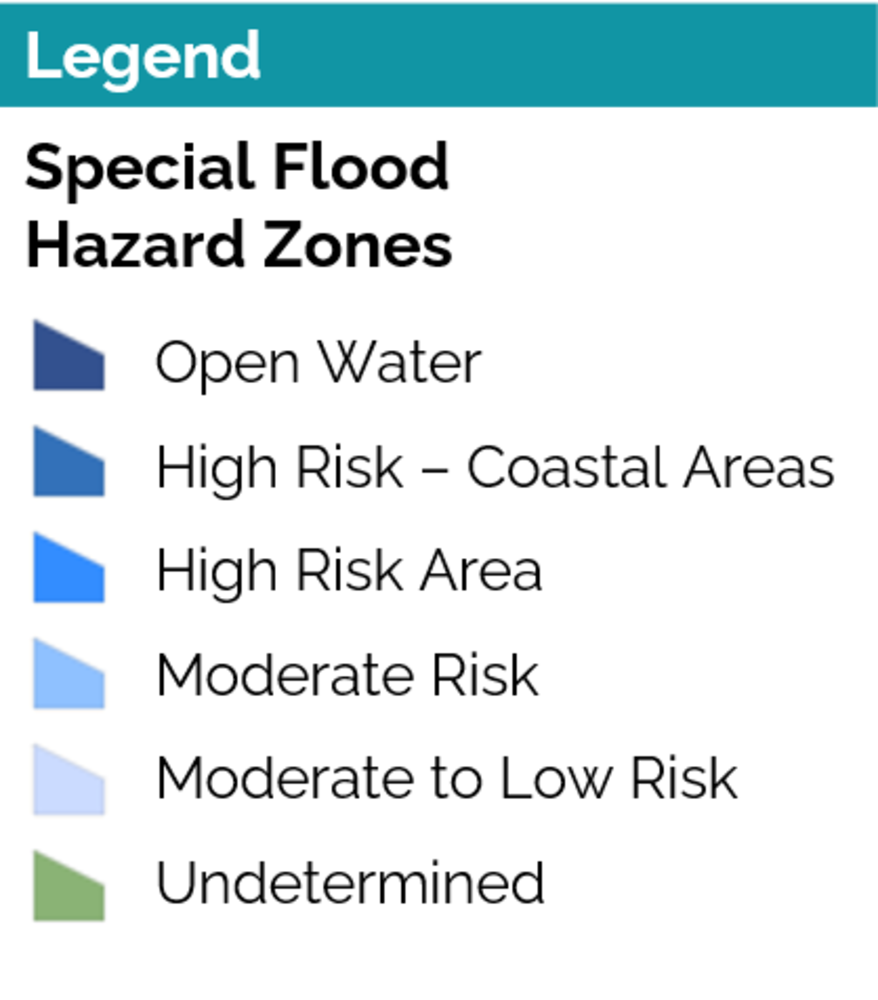
Special Flood Hazard Zone Data is produced by the State Emergency Response Team (SERT), in conjunction with the Federal Emergency Management Administration (FEMA). The map to the right shows the areas of the region that are at various risk levels to flooding.
Please note: this map contains large data files and may take longer to load.
Zoom in for quicker loading times.

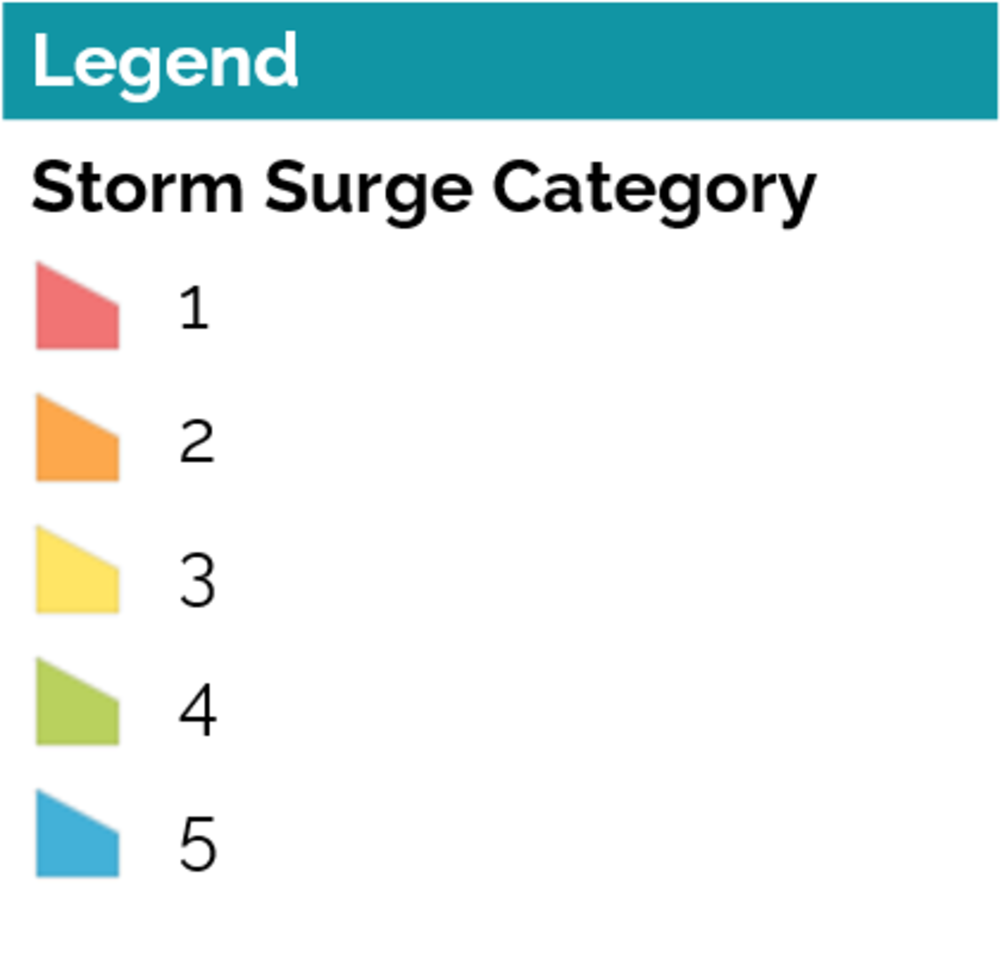
Storm Surge Data is also produced by SERT, in conjunction with FEMA. The map to the right shows the areas of the region that could potentially be impacted by storm surge. Each zone below represents an area that could potentially experience storm surge during that category of hurricane. (For example, areas in zone 3 may experience storm surge during a Category 3 hurricane.)
Please note: this map contains large data files and may take longer to load.
Zoom in for quicker loading times.