Water Quality Benefits Evaluation Toolkit – Pollutant Loading Models
Water Quality Benefits Evaluation Toolkit – Pollutant Loading Models
King County is committed to making big investments in water quality over the next decade. The Water Quality Benefits Evaluation (WQBE) Toolkit will support the County in identifying water quality improvements that are effective at reducing pollutants and improving ecological and human health.
Pollutant loading models estimate the amount of pollutants entering King County waterbodies and where they come from. This helps us understand which sources and pathways are likely the biggest contributors of each of the modelled pollutants and establish a baseline that we can measure against as we evaluate how well potential actions and programs would improve water quality.
How to use this site
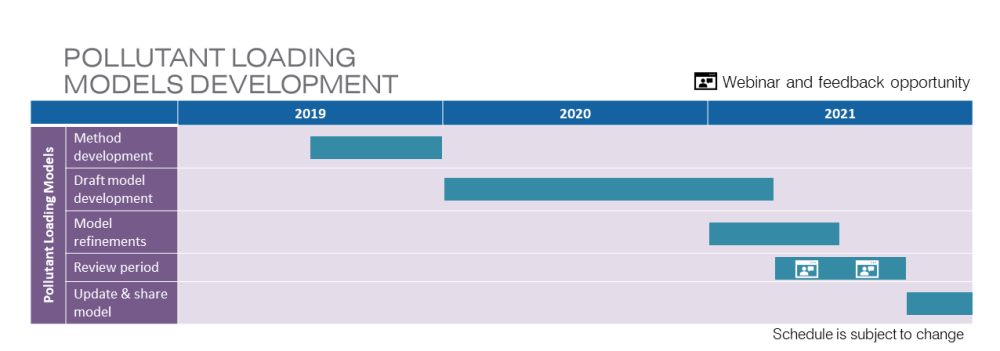
Visit each tab to learn more about the models. All information presented here is subject to change as the models are further refined.
If you would like to request data from the watershed model, please fill out this form and we will set up a meeting with you.
Overview
Pollutant Loading Models Overview
Watch an overview presentation about the pollutant loading models from the May 11, 2021 webinar presented by Carly Greyell (project manager).
What are the pollutant loading models?
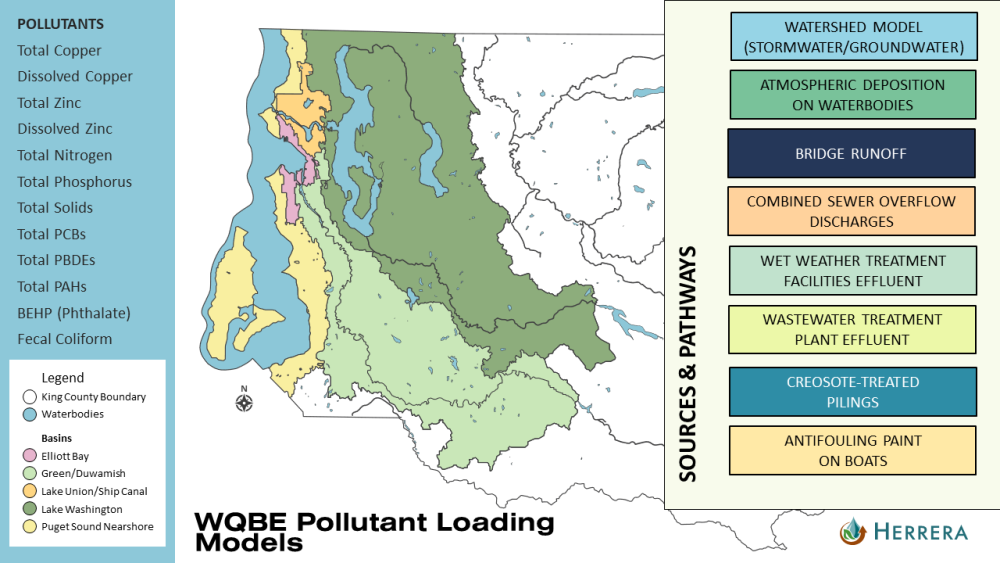
The pollutant loading models estimate the amount of pollutants entering King County waterbodies and where they come from. The WQBE Toolkit includes a watershed model that estimates continuous hydrology and pollutant loading time-series from stormwater and groundwater across King County watersheds. The Toolkit also includes several simple models for other pollutant sources and pathways to King County waterbodies, which include:
Atmospheric deposition onto receiving waterbodies (pathway)
Runoff from motor vehicle bridges crossing receiving waterbodies (pathway)
Uncontrolled and controlled combined sewer overflows (CSOs) (pathway)
Wet weather treatment facilities (pathway)
Wastewater treatment plants (pathway)
Antifouling paint on boats (source)
Creosote treated pilings (source)
At this time the pollutant loading models do not include loadings from contaminated sediment.
Pollutants were selected to model based on available data and relevance to water quality regulations. Pollutants that had insufficient data to quantitatively model were still considered for inclusion in the WQBE causal models. The pollutants included in the loading models are:
Total and dissolved copper
Total and dissolved zinc
Total nitrogen
Total phosphorus
Total solids
Total polychlorinated biphenyls (PCBs)
Total polybrominated diphenyl ethers (PBDEs)
Total polycyclic aromatic hydrocarbons (PAHs)
Bis-2-ethylhexyl phthalate (BEHP)
Fecal coliform
The main WQBE study area includes the following 5 major waterbodies, although the watershed model extends to cover the rest of King County:
Elliott Bay
Green/Duwamish River
Lake Union/Ship Canal
Lake Washington
Puget Sound nearshore
Why are we developing pollutant loading models?
Pollutant loading models help us estimate the amount of pollutants entering King County waterbodies and where they come from. This helps us understand which sources and pathways are likely the biggest contributors of each of the modelled pollutants and they establish a baseline that we can measure against as we evaluate potential actions and programs to improve water quality. The models can answer questions such as:
How do current average annual pollutant loads compare across the different sources and pathways?
How do average annual stormwater volume and pollutant loads compare across the modelled areas?
Timeline for pollutant loading models
How will the pollutant loading models be used?
Pollutant loading information can be used for a variety of projects, but in the near-term, the watershed model will be used to provide the foundation for the SUSTAIN (System for Urban Stormwater Treatment and Analysis Integration) models, which estimate the cost-effectiveness of different types of stormwater programs. This information will be used by King County to inform planning-level estimates of the potential cost and pollutant reduction of different types of stormwater investments.
Sources and Pathways
The models estimate the amount of pollutants coming from a range of different pathways and point sources. Below you’ll see an overview of each of the pathways and point sources.
Stormwater/Groundwater (Watershed model)
The bulk of our effort has gone to developing a watershed model that estimates hydrology or flow patterns across the watershed as well as associated pollutant loads. The next tab provides detail about the methods and calibration of that model.
Atmospheric deposition
Atmospheric deposition is the process where rain, snow, and fog move particles, aerosols, and gases from the atmosphere to the Earth's surface. This model specifically focuses on deposition to water bodies since deposition to land becomes part of the stormwater pathway and is accounted for through the watershed model. We estimated annual pollutant loading rates by multiplying deposition rates by the surface area of the receiving waterbodies. We used deposition rates measured in previous studies from 2011-2013 for total PCBs, copper, and zinc, and from 2011-2012 for total PAHs and PBDEs.
Antifouling paint from boats
Antifouling paint is used on boats to prevent marine organisms from attaching to the hull. It is also a pathway for copper to enter waterbodies. We estimated annual total copper loading rates from antifouling paint by multiplying the leaching rate of copper from boats determined by previous studies by the estimated surface area of boat hull bottoms in receiving waterbodies. We determined the type and number of vessels by using satellite imagery and marine traffic data. Then we calculated the surface area of the boats using assumptions about boat hull geometry, vessel type, and days per year the boats spend in the area.
Bridge runoff
Runoff from vehicles traveling on bridges across water is a pathway for a variety of pollutants. To determine the pollutant load from this pathway, we gathered data on treated and untreated runoff volumes for representative bridge types and pollutant concentration and calculated bridge surface area using GIS and mapping software.
Creosote-treated pilings
Creosote or coal tar has been used as a wood preservative for pilings that support docks and piers in the Puget Sound. These pilings leach PAH into the water column throughout their lifetime. We estimated annual PAH loading by multiplying leaching rates determined from previous studies by the estimated surface area of the pilings. The total surface area was approximated using aerial maps to estimate the number of pilings, bathymetry data to estimate piling length, and piling diameter estimates.
Combined sewer overflow (CSO) discharges
CSOs are relief points in sewer systems that carry sewage and stormwater in the same pipe. When heavy rains fill the pipes, CSOs release sewage and stormwater into rivers, lakes, or the Puget Sound. For preliminary modeling, we used data collected on the water quality of CSO discharges and data on observed discharges to estimate the pollutant load. However, the frequency and volume of CSO discharges are changing as new treatment comes online and we are now using modelled volumes that better represent how conditions will be in the near future. Please see the methods documentation for more information about this choice.
Wet weather treatment facilities
Wet weather treatment facilities are a CSO control method that treat the overflows through settling, disinfection of the water with chlorine, and dechlorination prior to discharge. Four wet weather treatment facilities discharge to the WQBE receiving waterbodies—Alki, Carkeek, Elliott West and Henderson MLK facilities. We calculated pollutant loads by using the observed discharged volumes and data on the water quality of the discharge.
Wastewater treatment facilities
There are three regional wastewater treatment plants that serve King County: the West Point plant in the City of Seattle, the South plant in the City of Renton, and Brightwater plant near Woodinville. Additionally, there is one local wastewater treatment plant located on the northeast side of Vashon Island. Pollutant load estimates for the regional facilities were previously developed to support King County’s Clean Water Plan.