The case of Citi Bike: Capturing public engagement data to prevent setbacks
This past week, I found myself unable to put down a book by New York City’s former transportation commissioner, Janette Sadik-Khan. In Street Fight, she outlines her experiences of making big transportation changes in a city where change is notoriously hard.
One story in particular caught my attention. When working on the citywide roll-out of Citi Bike, New York’s bike share system, Sadik-Khan did something unusual with the public engagement process. She used data in a surprising, effective way.
Anticipating pushback to Citi Bike
To implement bike share, the city needed to find places for the docking stations that house the bikes. And in a city where competition for precious sidewalk space is intense, the stations would inevitably face resistance from community groups and businesses. So what to do?
Like many other transportation agencies, NYC’s transportation staff organized extensive stakeholder conversations, presentations, and public meetings to gather input on the bike share program and the placement of its docking stations.
What she did next though, is something few cities get right. She captured the data involved in the public process to quantify the number of opportunities the public had to share their input. The report highlighted specific metrics for both online and offline activities like public meetings, stakeholders engaged, online map comments, and poll question results. You can view the full outreach document here.
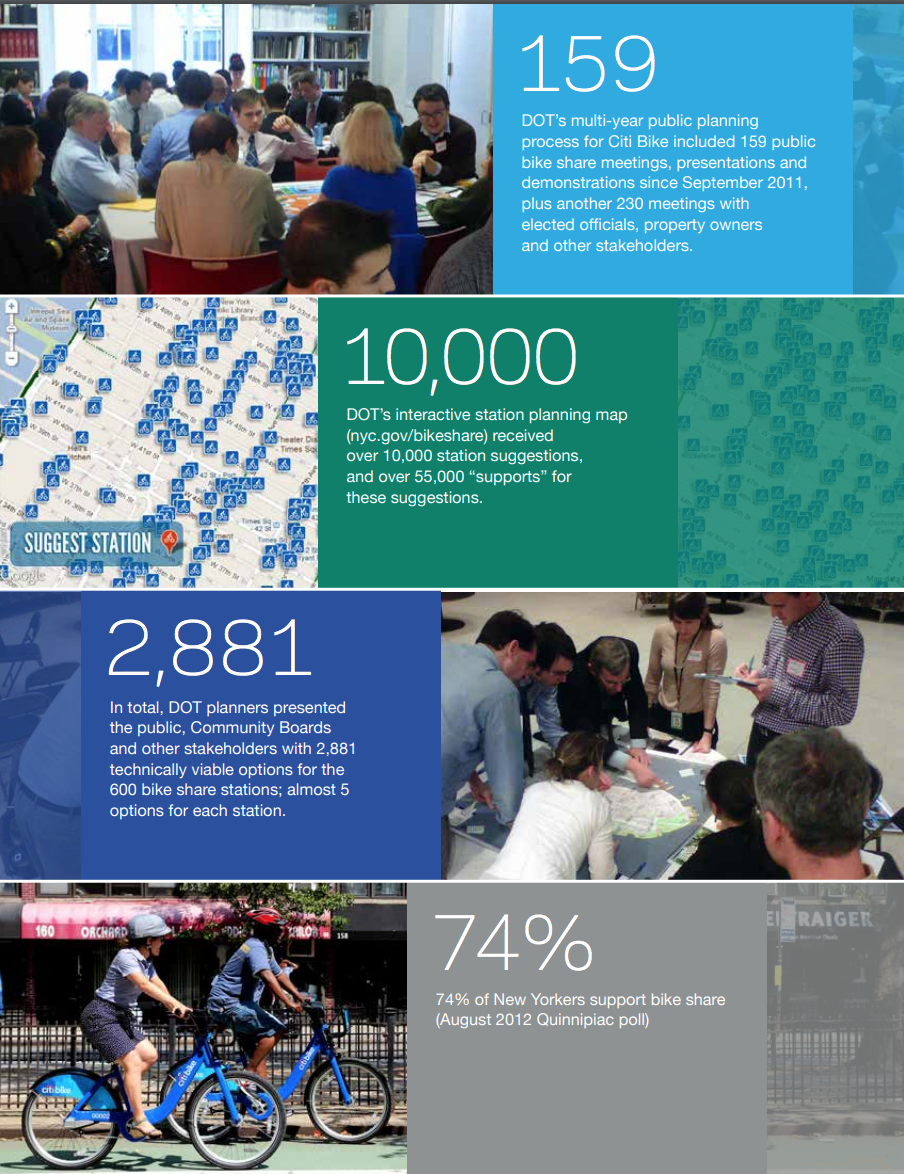
New York’s outreach summary for bike share captured and quantified online & offline engagement.
The lawsuits arrive as expected
Within weeks of launching Citi Bike, the city’s transportation department was sued five separate times over bike share stations. In short order, each lawsuit was dismissed. But what’s interesting is not the fact that the cases were dismissed, it’s why they were dismissed:
Sadik-Khan explains that in each case, city attorneys provided the judge the public outreach summary document. When judges saw the well-publicized outreach, transparent process, and quantified public support, their decision at that point was easy. Case dismissed.
Like her boss, Michael Bloomberg, Sadik-Khan understood the power of data and used it to prevent her opponents from derailing and delaying important projects.
Public involvement data is powerful, if captured
Right now you might be thinking, “Wow, 159 meetings is way more than we’ll ever do”. But in cities of almost any size, it’s not unusual to see public meetings number in the hundreds. Here in Raleigh, a quick audit of public engagement revealed over 800 opportunities for residents to give their input in 2017 alone.
In a time when we’re increasingly talking about the role of data in government, it’s important to include public engagement data in that conversation. One needs look no further than the case of Citi Bike to see why failing to quantify that data can have real consequences.
Public engagement, when quantified, can be your backstop and your best ally for moving forward in the face of inevitable resistance to change.
Why low-data situations are prime opportunities for the loudest voices
Citi Bike is a high profile example, but every day countless of mini-dramas play out across the country as competing interests seek to shape our cities.
In the absence of a consistent engagement process and good documentation, most decisions fall into the land of ‘anecdata’ – anecdotal stories and data points.
These no-data and low-data situations are a recipe for the loudest voices to get their way.
For the purposes of thinking through the implications here, let’s look at a few common scenarios, each with and without good data capture:
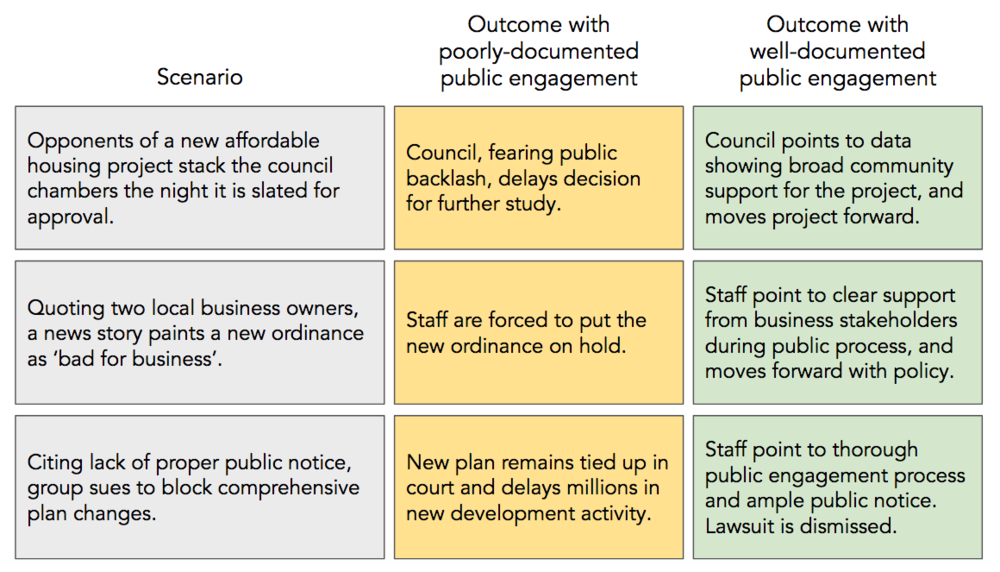
Simply capturing the data from your public engagement efforts can save major headaches and cost down the road.
Getting started on a path to consistency and data
Becoming great at engagement does not mean re-inventing the wheel – the first step is capturing and quantifying what you already do.
With PublicInput.com you have one central database of public engagement activity across every engagement channel – whether online or off. Getting 100% of your engagement processes into that workflow can take some time, but a simple engagement audit can identify places where capturing data can happen easily and generate immediate ROI.
It all starts with a conversation, and we’d be happy to share what we’ve learned working with cities and state agencies to see what could be applicable in your work. Drop us a note here and we’ll be in touch!

