Community Engagement Reporting: Turning Participation Into Proof

When reporting is designed as a shared process, engagement data becomes understanding—not just documentation.
Collecting community input is essential, but it’s not enough. To build trust and move projects forward, agencies must be able to translate participation into insights that decision-makers, stakeholders, and the public can understand.
Reporting is where engagement becomes actionable, and where transparency is either reinforced or undermined.
This blog focuses on how thoughtful reporting bridges the gap between community input and informed decisions.
Reporting as a Strategic Practice
Effective reporting isn’t about summarizing everything that was said. It’s about identifying what matters to the community, why it matters, and how it should inform next steps.
Our Analysis blog focuses on the interpretive work that turns engagement data into insight. Reporting is where that work becomes visible, translating analysis into a clear narrative that decision-makers and stakeholders can understand and act on.
Strong reports answer practical questions:
- What themes are emerging?
- Who participated and who didn’t?
- How do perspectives vary by geography or demographic?
- What does this mean for the decision at hand?
Tailoring Reports to Your Audience
Not all stakeholders need the same level of detail. Elected officials may need high-level trends, while staff teams require deeper breakdowns. Community members often want clarity on how their input fits into the bigger picture.
PublicInput’s reporting tools allow agencies to filter and segment engagement data by project, tactic, geography, and participant attributes—making it easier to generate reports that are appropriate, focused, and credible for different audiences.
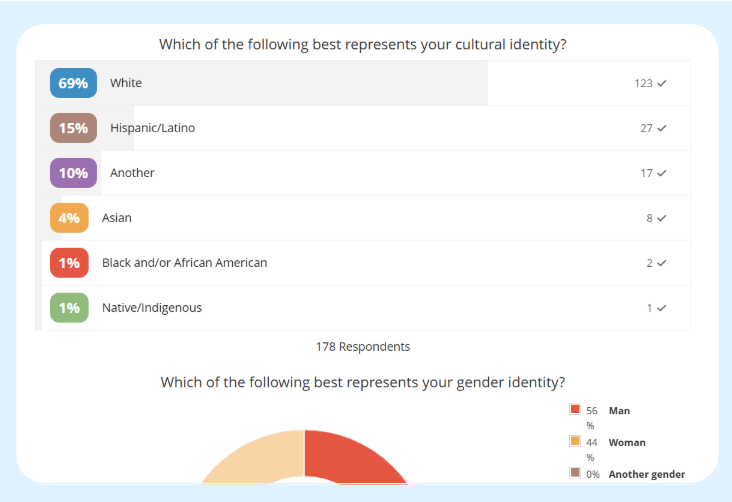
Above Image: PublicInput offers agencies dynamic, real-time reporting that helps turn community participation into clear, decision-ready insight.
This flexibility supports clearer communication and avoids the frustration of one-size-fits-all reporting.
Visualizing Patterns and Participation
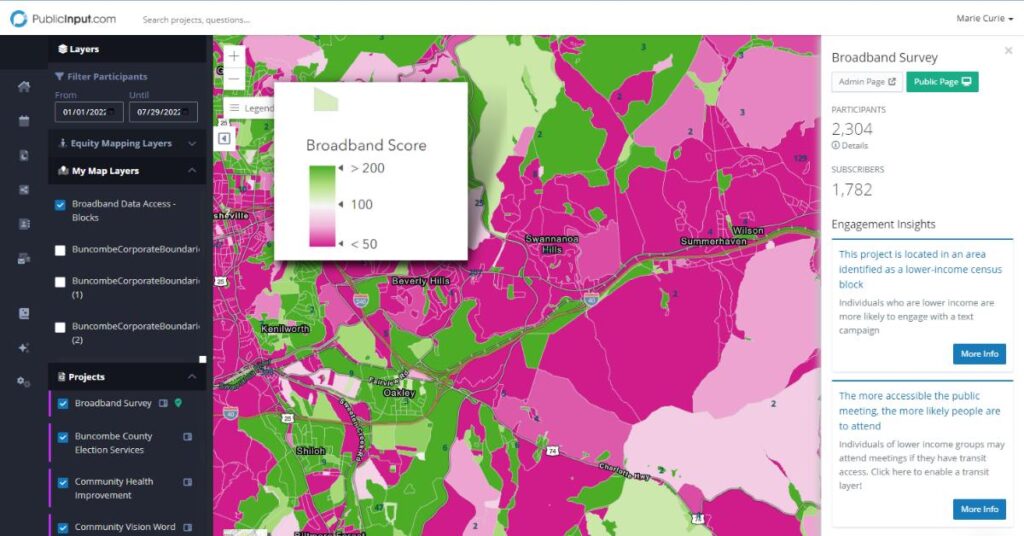
Visualization plays a critical role in understanding engagement outcomes. Maps, charts, and dashboards can reveal participation gaps, geographic concentrations, or disparities that aren’t immediately visible in raw data.
PublicInput’s Equity Mapping overlays engagement data with demographic and environmental layers, helping teams see who is represented—and who may still be missing. These insights allow agencies to refine outreach strategies and explain participation trends with greater clarity.
For more foundational thinking on how visualization supports engagement analysis, see our Analysis blog.
Connecting Input to Outcomes
Perhaps the most important role of reporting is demonstrating how community input influenced decisions.
Clear documentation of themes, trade-offs, and decision rationales helps agencies show that engagement wasn’t performative—it mattered. This connection reinforces trust and sets expectations for future engagement efforts.
When reporting is consistent and accessible, it becomes a tool for shared understanding rather than a compliance exercise.
Is your agency looking for better ways to translate engagement data into clear, credible reports? Get a demo and see how PublicInput helps agencies of all sizes turn participation into insights that support informed decisions and transparent communication.