Public Engagement Analytics Platform: Turning Community Data Into Defensible Decisions
Collecting engagement data is not new for government agencies. From surveys and public meetings to comment forms, SMS, and interactive maps, input comes in from multiple channels across multiple projects, often simultaneously. Some agencies have strong systems to make sense of it. Others are still working to bring it together. The difference comes down to how easily that data can be turned into insight and action..
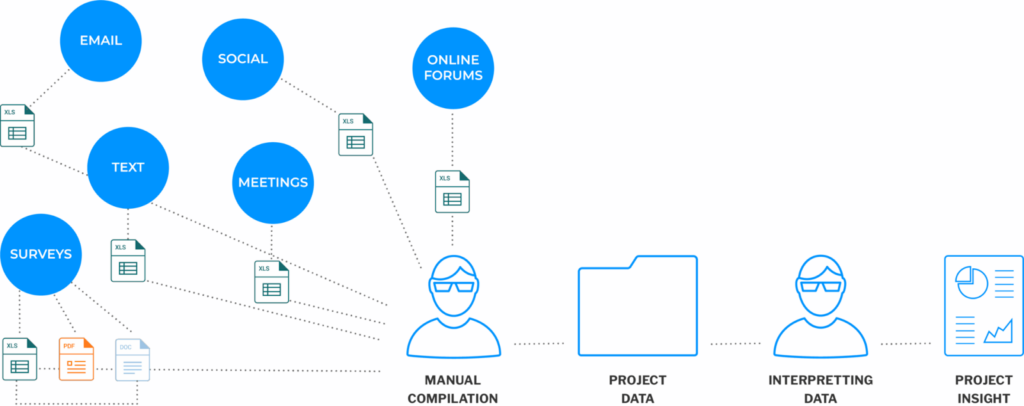
Without a system designed to organize, analyze, and present engagement data, that work falls to staff. Someone is exporting CSVs, building manual dashboards, reading through hundreds of open-ended comments to identify themes, and compiling reports that take days to produce. The insight is in there. Getting to it is the problem.
Public engagement analytics and reporting built for government is designed to close that gap, turning raw participation data into structured, decision-ready insight without the manual overhead.
What Is a Public Engagement Analytics Platform?
A public engagement analytics platform is a purpose-built system for organizing, analyzing, and reporting on community participation data across channels, projects, and populations. It goes well beyond a dashboard or an export function. It brings together input from surveys, public meetings, comment forms, and outreach channels into a unified analytical environment where patterns become visible and reports become producible.
The distinction from general business intelligence tools matters. General business intelligence tools are built for business metrics. Public engagement analytics is built for a different set of questions: who participated, whether that participation was representative, what the community said, how does that input vary across geography and demographics, and how can the agency demonstrate that these variables were considered?
The agencies that rely on this kind of platform include DOT and MPO engagement programs with federal reporting obligations, transit agency engagement teams navigating Title VI requirements, and local government planning departments using engagement outcomes to inform decisions with elected officials and the public. What they share is a need to turn participation into proof.
Why Raw Engagement Data Isn’t Enough
Collecting engagement data and being able to use it are two different things. Three structural gaps show up consistently when agencies try to work with raw data without a purpose-built analytics layer.
Volume without structure. A public comment period for a major transportation project might generate hundreds or thousands of open-ended responses. Without AI-assisted theme clustering, those comments require staff to read, categorize, and summarize manually. It’s time-consuming, inconsistent across reviewers, and nearly impossible to replicate at scale. The insight is present. Extracting it isn’t practical.
Data without context. Response counts tell agencies how many people participated. They don’t tell agencies whether those people represent the affected community, where the participation gaps are, or how perspectives vary across neighborhoods, income levels, or language groups. A survey with 500 responses that all came from the same two zip codes isn’t representative data, but without geographic and demographic analysis built in, that’s not visible until someone looks for it.
Insight without distribution. Analysis that lives in a staff member’s spreadsheet doesn’t inform decisions at the leadership level or build public trust. Reports that take days to produce don’t get produced consistently. When the analytical output isn’t structured for distribution, the engagement work that generated it doesn’t have the impact it should.
Collecting data is the beginning of the engagement record, not the end of it. What agencies do with that data determines whether the engagement was meaningful or just performative.
What a Public Engagement Analytics Platform Covers
A well-designed platform handles the analytical work that currently requires manual effort, and it does so in a way that produces outputs agencies can actually use.
Government survey and project tools feed data directly into the analytics environment, so every response is already tied to a project, a channel, a timestamp, and a participant profile. Nothing needs to be imported or reconciled manually before analysis can begin.
AI comment analysis and theme clustering organize open-ended responses by topic automatically. Staff can see what the community is saying about specific issues without reading every comment individually. Thousands of responses become a structured summary in minutes rather than days.
Sentiment detection goes a step further, identifying community position on specific topics rather than just volume. An agency can see not just that a corridor project generated significant feedback, but that concerns about safety were the dominant theme and that sentiment varied significantly between two neighborhoods along the route.
Demographic and geographic analysis overlays participation data with population data, making it possible to see who engaged and how that compares to who is affected. Equity Mapping takes this further, identifying specific populations or geographies where participation was low and outreach may need to be strengthened.
Cross-project and longitudinal reporting allows agencies to track engagement patterns over time and across initiatives. That continuity matters for agencies managing long-range plans, capital programs, or recurring community processes.
Export-ready, leadership-ready reports can be generated directly from the platform without manual compilation. The same underlying data that drives staff analysis can produce a summary for an elected official, a technical appendix for a federal report, or a public-facing summary for the project page.
PublicInput’s analytics platform turns participation data into structured insight, from AI comment analysis to geographic equity mapping, in a single environment.
What Defensible Decisions Actually Require
Agencies presenting engagement outcomes to leadership, regulators, or the public need to be able to answer a specific set of questions clearly and consistently.
Who participated? Not just a count, but a description of the participating population and how it compares to the affected community. Where were the gaps, and what does that mean for how the input should be weighted?
What did the community say? Not a raw export of comments, but a structured summary of themes, concerns, and priorities that decision-makers can actually read and use.
How was the input considered? The connection between what the community said and the decisions that followed. Documentation that the engagement wasn’t performative.
Would this record hold up under formal review? An open records request, a Title VI audit, or a project challenge all require the same thing: a complete, organized, and credible engagement record that was produced as a natural output of the process, not assembled under pressure afterward.
A public engagement analytics platform is what makes those answers consistently available without extraordinary staff effort.
Who Needs a Dedicated Analytics Platform
The clearest indicator is any agency with a formal obligation to demonstrate that engagement was inclusive, representative, and meaningfully connected to decisions.
Federal reporting obligations: DOTs, MPOs, and transit agencies receiving federal funding are required to demonstrate equitable participation. That requirement has a specific documentation standard that general reporting tools weren’t built to meet.
Leadership and public accountability: Any agency presenting engagement outcomes to elected officials, boards, or the public needs outputs that are structured, credible, and produced consistently, not dependent on one staff member’s spreadsheet skills.
Multi-project programs: Agencies managing concurrent or sequential projects need to track participation patterns across initiatives and over time. A platform designed for single-project reporting can’t surface those longitudinal patterns.
Staff capacity constraints: Any team spending significant hours compiling engagement reports manually is absorbing a cost that a purpose-built analytics platform eliminates. The time savings alone often justify the investment.
Putting the Data to Work
Agencies doing this work well aren’t necessarily the ones with the most data. They’re the ones with a system that turns data into something their communities, leadership, and regulators can trust.
The analytical work is already happening in most agencies. The question is whether it’s happening in a system that produces consistent, defensible outputs — or in a spreadsheet that one person maintains.See how public engagement analytics and reporting built for government turns community participation into the kind of insight that supports better decisions and clearer accountability.