Making The Invisible Visible: A Look at Diversity in Local Government and Equity in Community Engagement in 2020
The Diversity Dashboard is a year-round project conducted by ELGL, made possible by their staff and PublicInput.com. First started in 2018, the Diversity Dashboard is the first ever national data collection on the gender, race, age, and veteran status of local government employees.
In 2020, overall participation in the Diversity Dashboard doubled from 2019, with over 1,050 participants across 42 states.
What does the data say?
2020 Census results are yet to be made public, but here’s how government staff compares on a national level based on July 2019 data. Diversity Dashboard data also shows where local government is moving in terms of replacement rate based on age:


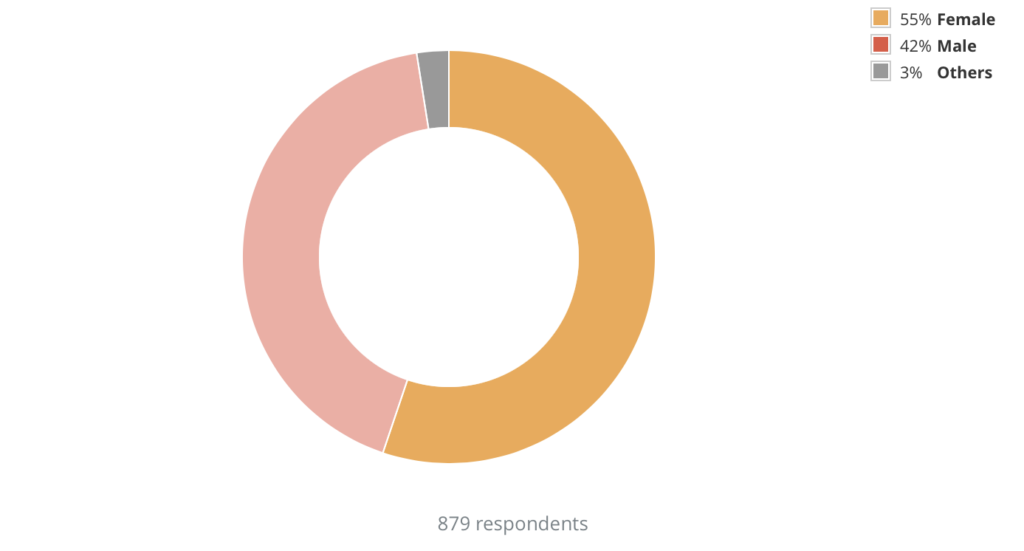
Addressing equity in our communities
While government staffing sees continued need for more representation, a similar need for equity shows up in the work of government organizations as they conduct public engagement.
According to a May 2020 survey by PublicInput.com, ensuring representative, equitable engagement was the top concern of local government organizations.

While every community is different, there are three guiding principles that local governments can look towards for increasing representative, equitable engagement.
1. Provide empathy through technology
Virtual tactics are vital for meeting people where they are. We also must be mindful of the digital divide by creating multiple, redundant ways for the public to participate. As more virtual tactics are adopted, it’s important to balance virtual engagement with measurable results. Technology is also making it possible to reach Environmental Justice communities from day one of every project.
2. Unify public engagement efforts
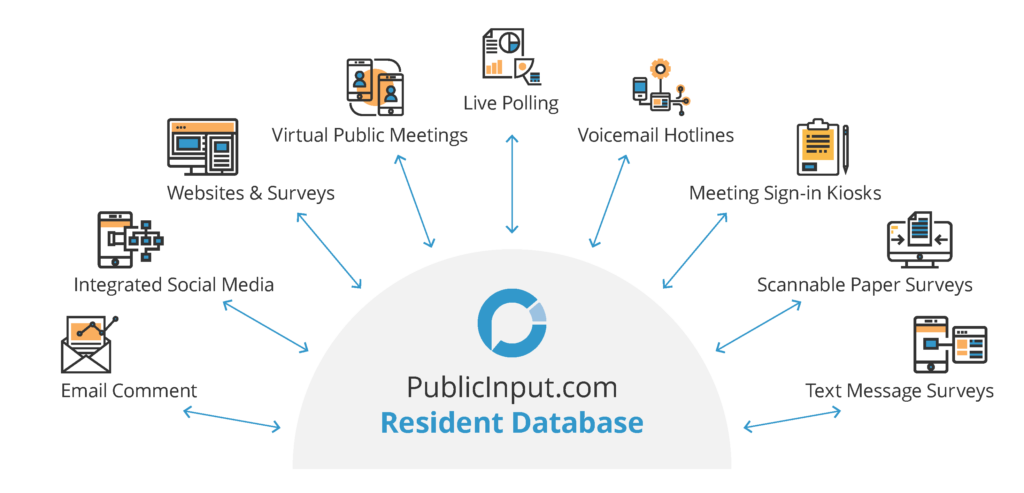
Through academic research and public engagement case studies, we know that mix-mode engagement works to increase public participation from traditionally hard-to-reach populations. Residents are more likely to engage when reached through a format familiar to them: whether that’s through an email, social media, text messaging, or more traditional in-person meetings or mailers. To see the complete picture, we can’t allow public engagement data to be siloed off into separate tools for every tactic, which is why it is important to have a single-source of truth that holds all public input.
3. Build on existing trust and social capital
Once you’ve engaged with a resident, don’t let them fall through the cracks. Instead, build a Resident Database so that you can continue to engage with residents over time and close the feedback loop. Organizations can also use the existing social capital of community groups like houses of worship and local interest groups to help spread the word through their communication channels.
Are you a government employee?
Participate in the 2021 Diversity Dashboard!
This year’s Diversity Dashboard is now live. Please participate and spread the word so we can all see a fuller, more complete picture of government staff:

