Community Engagement Strategies to Overcome Gaps in Self-Identified Demographics

For decades, researchers have documented how nonresponses in demographic surveys can skew community engagement data. Learn more about how nonresponses from critical demographics limit the ability to document representation, and how PublicInput can help you directly address this issue in your community engagement efforts.
Research Summary
Research shows that nonresponse (not answering a demographic survey question) is potentially higher for various demographics. For example, rates of nonresponse are reported to be higher for…
- Females
- Individuals with lower education
- Self-Employed
- Homeowners
- Those with lower social status
- Age 65 and older
- African Americans
In fact, during an internal review of data gathering within the PublicInput platform, we discovered that 60% of respondents skipped optional demographic questions.
In order to further understand this challenge, researchers Maichou Lor, Barbara J. Bowers, Anna Krupp, and Nora Jacobson conducted another study. Their purpose? To identify whether motivation to complete demographic survey questions increased when respondents were provided a meaningful verbal explanation as to why the demographic questions were important.
The Participants
The respondents recruited for this study were chosen based on their demographics. Low income, low educated, or racial/ethnic minority individuals were recruited from specific neighborhoods. Out of these respondents, most were African American with a lower income. There was an even divide between female and male respondents.
After the results were tallied, research showed that…
- 5.6% indicated a range of intentional non-response to questions regarding their age
7.4% indicated a range of intentional non-response regarding their gender - 18.5% indicated a range of intentional non-response regarding their race
- 35.1% indicated a range of intentional non-response regarding their income
The Conclusion
While there were small to moderate improvements in response rates across all questions, 20% of respondents still intentionally did not respond to the question of personal income after being educated on the basis of the question. The results support that providing an explanation of the purpose of demographic questions does increase responsiveness overall, and that adding an explanation for demographic questions should be considered a Best Practice for demographic surveys.
The results don’t suggest, however, that this Best Practice is the only way to address this issue. Further strategies, such as passive data gathering, can play a role in qualifying data sets for community-based decision making.
Read the original article here at Survey Practice, an e-journal published by the American Association for Public Opinion Research. The mission of Survey Practice is to provide current information on issues in survey research and public opinion that is useful to survey and public opinion practitioners, new survey researchers, and those interested in survey and polling methods.
How community engagement practitioners can address nonresponsiveness in demographic survey questions
In its mission to create a more collaborative democracy, PublicInput focuses on gathering and centralizing data to create a value greater than the sum of its individual parts.Understanding what people say is relatively straightforward with survey tools that exist today. Understanding who is being represented is much more challenging.
How can we learn more about our communities– the “who”?
Equity Mapping is a PublicInput tool designed to help you understand representation by leveraging location data and comparing it with GIS-based equity indices that define underrepresented communities.
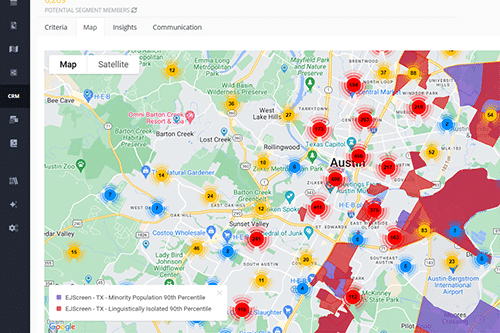
Equity Mapping allows agencies to…
Gather passive data to infer demographic and socioeconomic representation
While passive data is not 100% accurate, by collecting it from 100% of participants the margin of error decreases with every additional datapoint. For example, easily captured Geo-IP addresses assign participants a general location. This location can be used to infer a likely socioeconomic status based on census data.
The Strategy: Create and implement SOPs to ensure every interaction can be traced to a source location, then utilize Equity Mapping to determine the percent of participation derived from Underrepresented Communities.
The High Level Goal: Maintain a system of record that automatically captures participant information as they engage and stores that information in an enterprise-wide database so that your organization can benchmark representation and measure improvements.
Critical information includes capturing a unique identifier for each participant, accompanied by the location of the origin of their participation. This can include (listed in order of preference)…
- Self-identified home address,
- Self-identified home area (1000-ft radius),
- Geo-ip address
- Location of unique URL/QR Code/SMS short code that participation was sourced from
- Location of in-person meeting attended.
In order to achieve this, organizations must adopt a location-prioritized strategy and decide on the specific geographic “disadvantaged community index” that will serve as the foundation for analyzing effectiveness of engagement with underserved communities. They can then create a Segment in PublicInput’s CRM based on this data. Examples include…
- EPA EJScreen
- CEQ CLimate and Economic Justice Screening Tool
- HUD Qualified Census Tracts
- USDOT Transportation Disadvantaged Community index
- Locally determined indices such as CalEnviroScreen 4.0
Gather active resident data for more accurate results
In addition to passive data gathering, such as estimating geo-location based on IP addresses, PublicInput can facilitate active data gathering. Active data gathering is much more accurate than estimated geo-location.
PublicInput enables specific tasks to help you gather and attribute data. With PublicInput, you can…
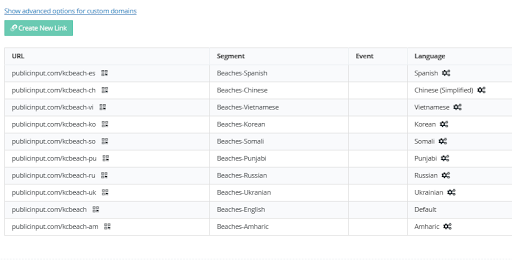
- Setup unique URLs to allow for participation in each appropriate language and automatic inclusion in metrics tracking Low-English Proficiency engagement
- Determine where physical signage should be deployed to promote engagement and setup unique URLs for each neighborhood for granular tracking and analysis
- Create a listing for all public meetings and integrate registration/sign-in sheets to document participation.
- Always include a general location question in online surveys or comment forms to allow for better information when participants are willing to volunteer it
Start your journey to gather more equitable, accurate engagement data
Interested in learning more about our Equity Mapping tool? Book a demo to explore how Equity Mapping can help you achieve more equitable and representative community engagement.