What’s the Difference Between Equitable and Representative Engagement?
Equitable; representative.
These two buzzwords are at the forefront of the conversation when it comes to civic engagement: equitable and representative. Sometimes they’re even used interchangeably. But engagement can be equitable without being representative– and it’s important to understand when to prioritize each so that we can place engagement data into context and make better informed decisions. Equity and representation aren’t an either/or in the world of civic engagement; they require an all-in approach that requires a balance of both to truly understand your community’s needs.
Equitable vs. Representative: What’s the Difference?
The easiest way to start is to look at the meaning of each word.
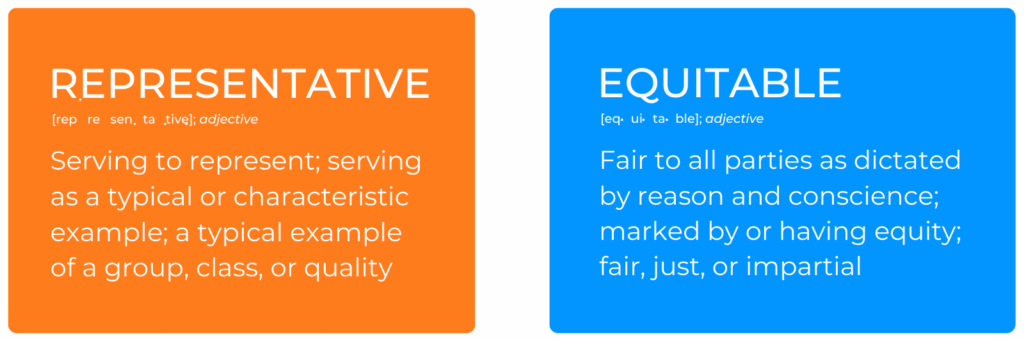
Equitable: Fair to all parties as dictated by reason and conscience; Marked by or having equity; fair, just, or impartial. In the world of civic engagement, equitable is most often defined as accessibility– making sure your engagement projects are easily accessible for everyone, regardless of their background.
Imagine your project as the second story of a building. How do you help people access the second floor?
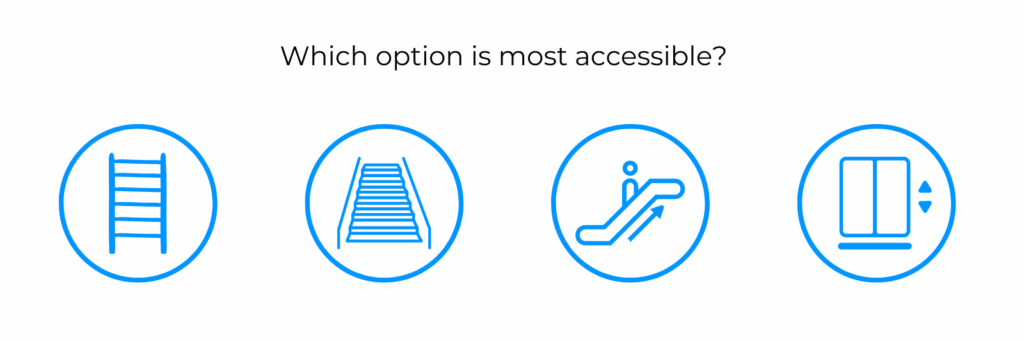
If you choose a ladder, you’re likely to get very few visitors to the second floor, and your visitors will be limited to people who can climb vertically without any restrictions. Stairs will make it accessible to more people, but even then, you will be limited to people who are physically capable of climbing stairs. An escalator removes the physical barrier but also only accommodates those who can stand on a moving platform without risk of injury.
So you choose an elevator and invest in visible signage throughout the building pointing visitors towards it. In this metaphor, an elevator is equity. Now almost everyone who enters the building can reach the second floor. This is the goal of equitable engagement: making projects easily accessible to everyone, so that everyone has an equal opportunity to provide input on how their governing bodies allocate resources, funding, and build up their communities.
Representative: Serving to represent; Serving as a typical or characteristic example; A typical example of a group, class, or quality. In civic engagement, representative feedback means that you’re receiving a good amount of feedback from the groups of people that can or will be affected by a project and—more importantly— those who have been historically left out of the conversation.
Representative feedback is all about context. You have to understand the nuance of how a potential policy or project can affect different demographics in your community.
Imagine you are planning a new affordable housing project. There are a lack of affordable housing options in your city, and many low-income families have been displaced by rising housing costs. This rent-controlled housing project would improve living conditions for low-income families that live and work in the city. You create a community survey to gather input. Over the next week, 1,000 people participate in your survey.
Out of the 1,000 people who answer, 800 of them say they do not believe this type of project is suitable for the neighborhood. Without context, you could state that 80% of the community response is negative, and thus you should not pursue the project.
But if you look deeper and add context to these responses, you can start to understand whether or not your current engagement data is representative of the people most likely to be impacted (positively or negatively) by the project.
You take a close look at the location and demographics of the current respondents and find the following information:
- 30% live within the vicinity of the project, which is taking place in an areas designated as a qualified census tract (QCT)
- 60% self-identified as upper middle class households
- 15% of the respondents self-identified as low-income households
- 60% own their home
- 10% have experienced housing insecurity in the past
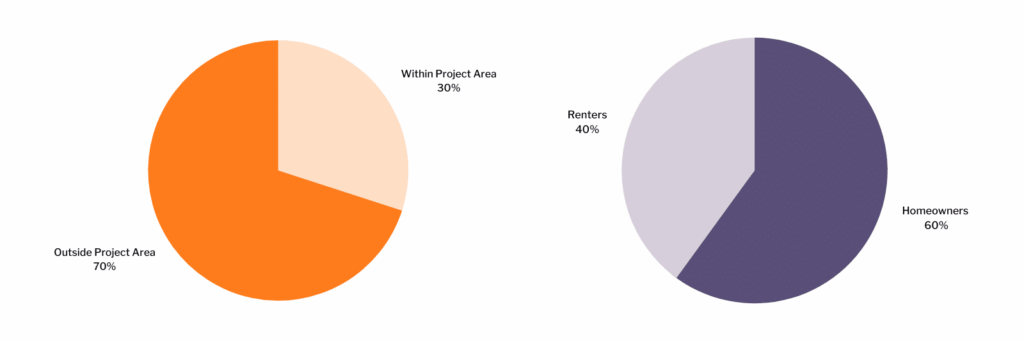
This information automatically starts to build context around your 1,000 participants. For example, the 60% of respondents who identified as upper middle class could be viewing the project from a different perspective than the 15% of respondents who identified themselves as low-income. Furthermore 70% of participants weren’t residents of the impacted neighborhood at all.
Data can be representative of one community without necessarily being representative of a larger population– just like how engagement can be equitable without necessarily being representative.
How Do I Know If My Engagement Data is Representative?
The goal of representative civic engagement is to ensure you’re receiving feedback from the people who will be impacted by an upcoming project or policy. The best way to determine whether your engagement data is representative is by placing it into context.
If you’re trying to collect feedback on a new bus route, you want engagement from people who regularly use public transportation. If the majority of people who respond are those who rely on personal vehicles for transport, then you are not receiving representative feedback.
Some important questions you can ask when planning an engagement project include…
- What is my target audience for this engagement project? Who are we trying to reach?
- What communities will be most affected (positively or negatively) by this project outcome?
- How can I gather data that will provide me with the context to understand who we reached and engaged with before we make decisions based on what was said?
Working in Tandem: How to Use Equitable Engagement and Location Data to Maximize Representative Feedback
Equitable and representative engagement are different things, but they go hand and hand. To truly understand and make well-informed decisions for your community, you need an all-in approach: a balance of both equity and representation. For example, when the opportunity to engage is equitable, you are more likely to receive representative feedback, because you are prioritizing engagement opportunities for everyone– not just assuming everyone has the same opportunities. The more decisions you make based on representative feedback, the more likely you are to build trust with your community.
It’s a cycle that builds momentum, insight, and trust in civic engagement. Once you identify the communities you want to prioritize for an engagement project, you can start to build a strategy designed to meet their needs for participation.
Here are a few examples of ways you can tailor your engagement efforts to maximize participation from your community.
- Does your target community have a large Spanish-speaking population? Consider creating unique and trackable links for your survey and project pages to afford them a tailored experience.
- Schedule conflicts might be a barrier to participate in a public meeting, whether online, in person, or via phone; record your meetings and post them on your public portal with an open comment box to allow community members to watch or listen and provide input after the fact.
- When you do host neighborhood meetings, ensure you capture attendance (even if it’s just numbers) and document feedback relative to the location of the meeting.
- Utilize physical signage such as text message short codes or QR codes unique to the different neighborhoods or corridors where you know communication has fallen short in the past, or where a project will directly impact residents.
These are just a few ways agencies can remove barriers to participation for their communities and allow for better reporting around who was engaged in the process without having to ask for self-identified demographic information.
Placing Engagement Data Into Context with PublicInput
Context is important when it comes to engagement data. But how do you gather the appropriate context in order to interpret your engagement data?
You can build in demographic-based questions, but this only works in survey format, and can be skewed by inaccurate answers. For example, the Census Bureau documented that in 2020 over 40% of Hispanics either did not respond to the race question, or reported being “Some Other Race”. You also need to be able to analyze data acquired via meetings, email, newsletters, and social media. PublicInput uses tools like Equity Mapping, dynamic reports, and our built in CRM database to help you track engagement data and put it into context.

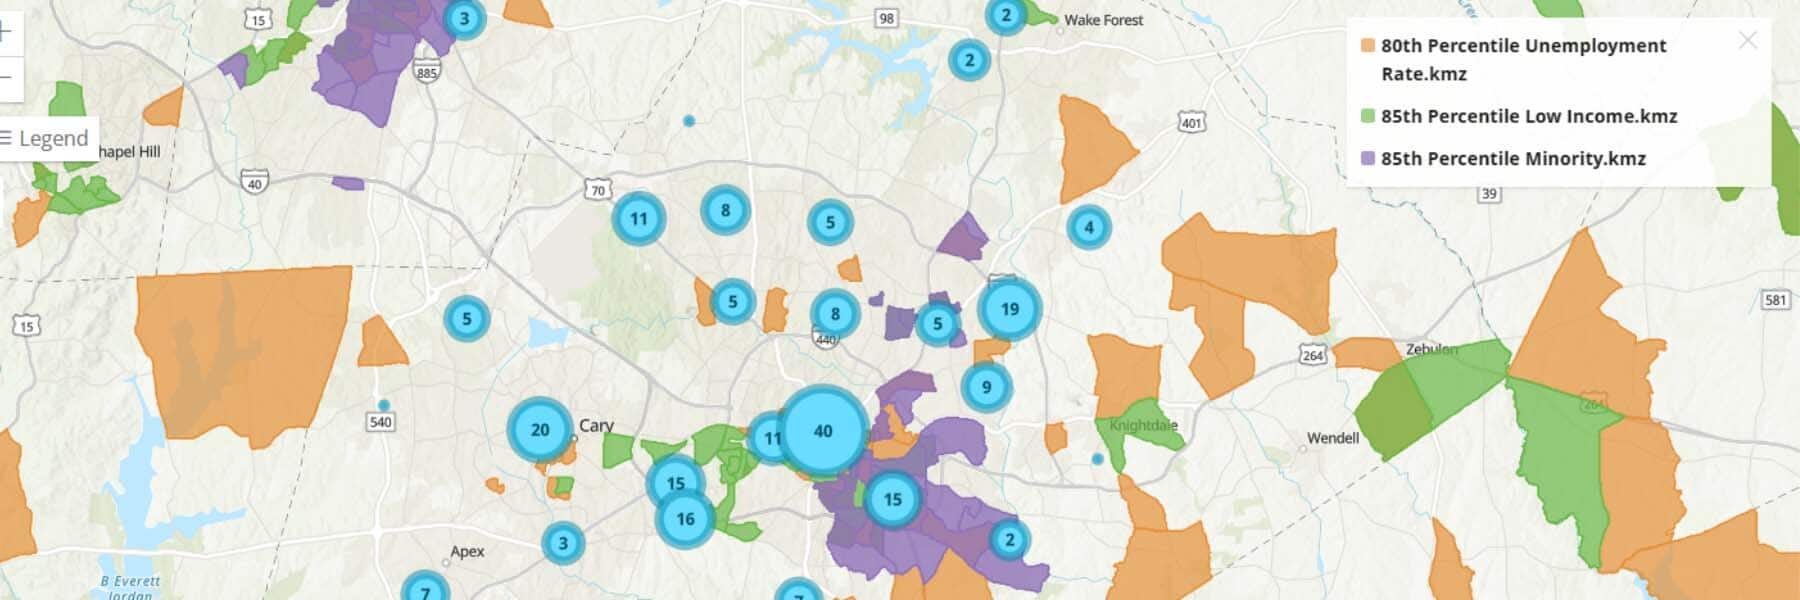
Equity Mapping lets you overlay engagement data with maps of your community, and draws information directly from the federal government, such as the EPA’s EJScreen, the USDOT’s Transportation Disadvantaged Community dataset, or HUD’s Qualified Census Tracts, for comparison. Compare a project’s data with maps that identify disadvantaged communities to see the who and when of your engagement data and better understand the what and why behind it.
Build Equitable Engagement Strategies with Equity Mapping
Want to know more about equity and representation? PublicInput has everything you need to help examine your projects over time to find the why, as well as take steps to build trust between your government and community. Every project you add to your equity mapping tool brings in more data to analyze.